In part two of our blog series about the current 'Solar in the Southeast' Annual Report, we examine policies behind the performance.
Bryan Jacob | July 1, 2020 | Florida, Georgia, Solar, South CarolinaIn all three years of SACE’s annual Solar in the Southeast report, we have included discussion about the policies behind the performance. For those of you who watched our webinar this year, you may recall that I specifically wanted to surface that conversation up front.

Download the Report
Watch The Webinar
Read the Report Blog Series
Policies vary from state-to-state and different policies work in different states. And 2019 was a clear example of that. We witnessed a legislative driver in South Carolina, regulatory drivers in Georgia, and utility-led drivers in Florida. In this post, we’ll begin to unpack the policies behind the performance.
We’ve talked in the past about legislative leadership from North Carolina – the only state in the Southeast with a Renewable Portfolio Standard (RPS). But this time around, the legislative driver I want to highlight comes from South Carolina.
Freedom Rings in South Carolina
In 2019, both chambers of the South Carolina General Assembly voted unanimously in favor of the Energy Freedom Act. This omnibus solar bill aims to sustain all segments of the solar market for the state.
The Act:
- Eliminated caps and extended net metering for distributed solar until mid-2021,
- Reinforced market access for utility-scale developers,
- Called for a green-tariff style program for large customers interested to source solar for their operations,
- And overall, specified that it is, “The intent of the General Assembly to expand the opportunity to support solar energy and support access to solar energy options for all South Carolinians, including those who lack the income to afford the upfront investment in solar panels or those who do not own their homes or have suitable rooftops.”
It should be noted that conservative, Republican leadership in both chambers championed this legislation. At its core, the Act is about economic development, job creation, and liberty (aka “energy freedom”).
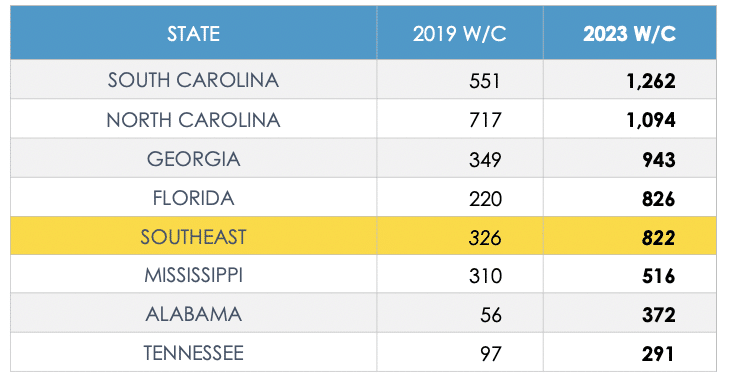
The results are already starting to be reflected in our SACE forecast. In prior reports, we had shown South Carolina converging on North Carolina in solar watts per customer (W/C). This year’s report is the first to show South Carolina overtaking North Carolina on this metric. The slide at the beginning of this blog (from page 12) forecasts that crossover in 2021, with the graph above projecting a margin between the Carolina’s of 168 W/C by 2023.
Public Service Commission Propels Progress in Georgia
Georgia’s only investor-owned utility, Georgia Power, updates its Integrated Resources Plan (IRP) every three years. Last year (2019) was an IRP year, and the Company proposed 1,000 megawatts (MW) of solar (exclusively for commercial and industrial customers). Intervening parties (including SACE) made a compelling case that economics currently favor solar and Georgia Power shouldn’t be offering the low-cost, clean energy ONLY to those commercial and industrial customers, but should be doing a lot more solar to put downward pressure on rates for the entire body of ratepaying customers.
These IRP proceedings play out over the course of six months, and at the end of the process, the Georgia Public Service Commission (PSC) issued an order requiring Georgia Power to source 2,210 MW of solar starting in 2022. Request For Proposals (RFPs) for the first tranche of those projects were just approved last month.
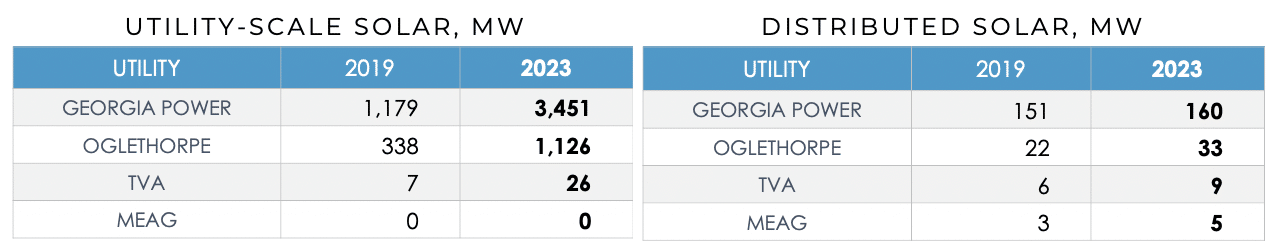
In addition to the 2019 IRP, Georgia Power also had a rate case last year (the first time they had done that in six years). I mention this because it was in the rate case docket that the PSC authorized true net metering for the first time. It’s only a pilot program, limited to 5,000 customers or 32 MW (just 0.2% of Georgia Power’s capacity). But it’s now more economically attractive for Georgia Power customers to install rooftop solar.
Our forecasts for utility-scale and distributed solar in Georgia are both higher now because of these regulatory policies.
And that brings me to Florida.
Florida, The Sunshine State, is Rising
Whereas in other states the significant pushes for solar come from legislators or regulators, in Florida, utilities themselves are exhibiting leadership and designing innovative policies to drive solar development.
The biggest recent example is Florida Power & Light (FPL). When FPL proposed its new shared solar program called SolarTogether, there was a total of 1.3 gigawatts (GW) of solar in the entire country. The FPL program itself is 1.49 GW (1,490 MW) – 20 separate 74.5 MW projects built over the next two years – so it will double the amount of “community” solar for the entire United States (and it’s just one utility in one state).
Now, to its credit, the Florida Public Service Commission did have to make a decision here. They had folks like us (SACE), along with others such as Walmart and VoteSolar, who had agreed to support the program as long as FPL included a carve-out for low-income customers to participate. The PSC also had internal staff and the Office of Public Counsel (OPC) to contend with, who opposed the program largely because it was different than anything they had seen before. In the end, the Florida PSC didn’t let the innovative nature of the SolarTogether program dissuade them and earlier this year, the Florida PSC approved this huge program.
FPL can’t solely claim credit for the increase in the Florida forecast. Several other utilities have announced expansions of their solar portfolios, as well.
Tampa Electric (TECO) is currently fulfilling its prior pledge to build 600 MW of solar but has already announced an additional 600 MW by 2022. Florida Municipal Power Agency (FMPA) has just brought online 149 MW out of its initial 223.5 MW commitment – and has already awarded contracts for an additional 149 MW. Gainesville Regional Utilities announced a 50 MW project.
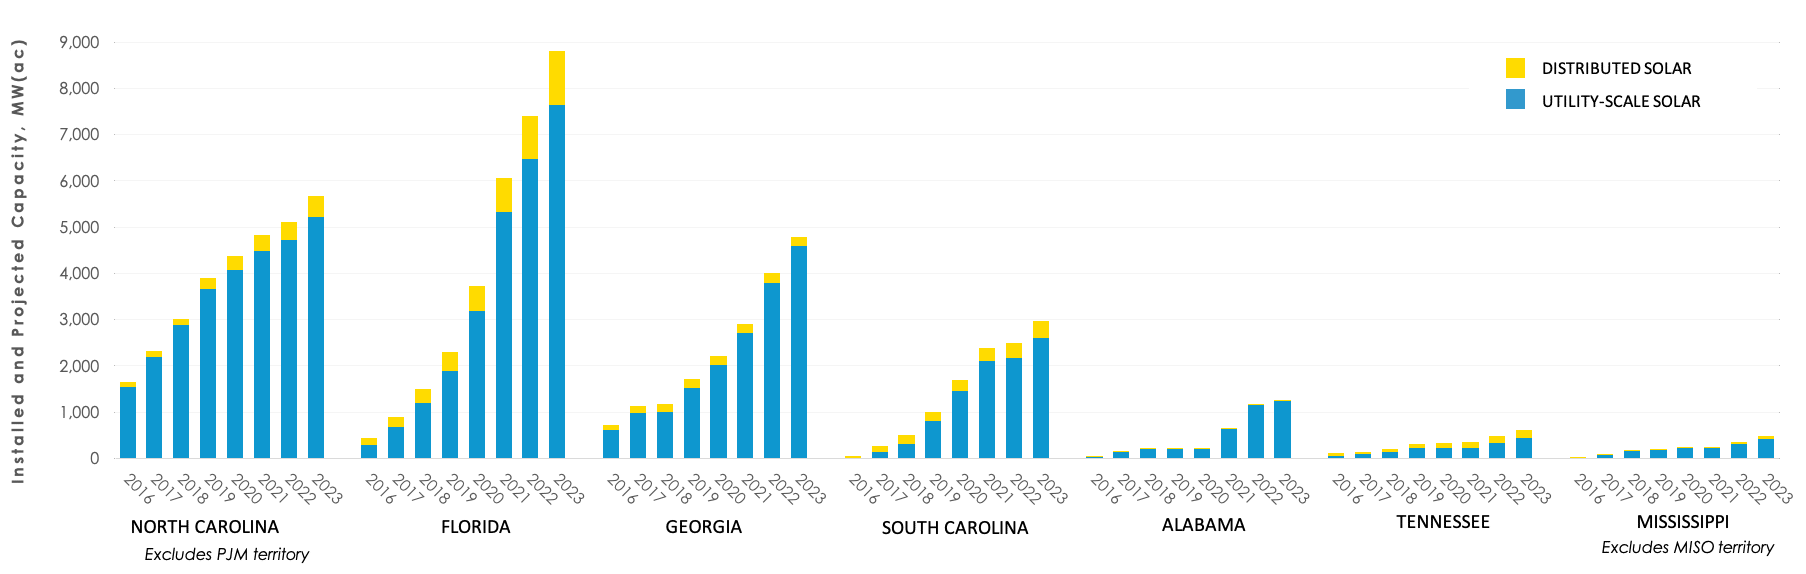
The net result of all those projects is: Florida will overtake North Carolina in installed solar capacity even earlier than originally projected. We now project that to happen in 2021. This huge milestone will make Florida number two in the country behind California.
The moral of this story is that policies matter – though successful policies can come in a variety of flavors.
These results illustrate that policies can either spur solar growth or stifle it. Our new report also points out adverse policies, like TVA canceling the Green Power Providers (GPP) program that had made them an early leader in rooftop solar. This, among other things, is keeping Tennessee’s solar ratio low (and kept TVA on our SunBlocker list).
Download the Report
Watch The Webinar
Read the Report Blog Series
#SSR2019