This blog post offers an introduction to SACE's sixth annual "Solar in the Southeast" report. Additional blogs in this series will unpack more of the key results and observations.
Bryan Jacob | June 14, 2023 | Energy Policy, Solar, Utilities18 gigawatts of solar and 580 watts per customer of solar in the Southeast region, new opportunities for solar from the Inflation Reduction Act, plus a new SunRiser and a new SunBlocker. Those are just some of the highlights in the latest installment of our “Solar in the Southeast” sixth annual report.

Download the Report Watch the Report Webinar Read the Report Blog Series
A year ago, when we published the fifth annual report, the solar industry was stymied by a global supply chain disruption. Now, due to decisive action by President Biden and by Congress, the industry is back on track. Projects that had been delayed last year are moving again. Progress has resumed.
In fact, the Southeast has now exceeded 18 GW (gigawatts) of solar – 18,776 MW (megawatts) to be more precise. This is more than triple the amount of solar reported in our first annual “Solar in the Southeast” report six years ago.
And after reducing the short-term forecast last year to reflect the supply chain disruption at the time, our 2024 forecast has now increased from 27 GW to 29 GW, based on current utility plans and filings. More significantly, SACE is now forecasting our seven-state Southeast region to have just shy of 40 GW for 2026. Wow!
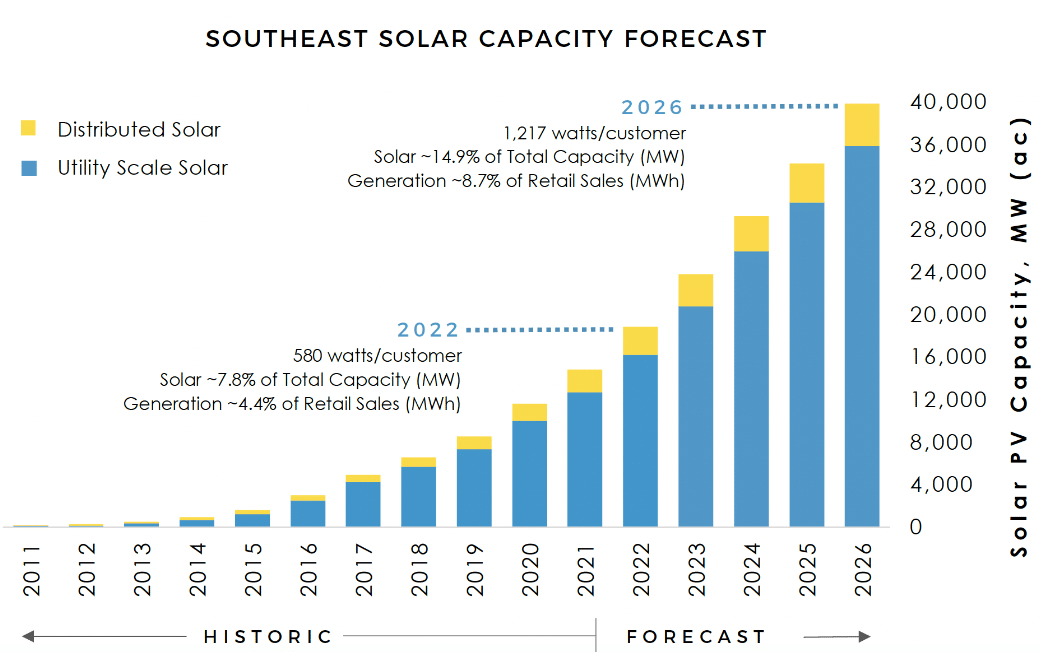
Our key metric reached 580 watts per customer (W/C) in 2022 and is forecast to be 1,217 W/C in 2026. SACE uses the W/C ratio to enable an equitable, unbiased comparison of various-sized utilities throughout our region, which is now home to more than 32 million retail customers.
And we have another reason to be even more optimistic: The Inflation Reduction Act (IRA) passed last year was the most significant climate and clean energy legislation in U.S. history. The package of tax credits and other incentives will assure progress on clean energy and emission reductions for the next decade.
IRA Opportunity for Non-Profit Utilities
In general, for-profit utilities have been deploying solar more rapidly than non-profit utilities. Congress recognized that and has now made the Investment Tax Credit (ITC) and Production Tax Credit (PTC) “direct pay” (refundable) for non-profit utilities. So municipal utilities and rural electric cooperatives can now take full advantage of those incentives that for-profit utilities have enjoyed for years.
While some rural electric cooperatives (co-ops) are indeed solar leaders, for example, Walton EMC in Georgia has been on our SunRiser list since 2018, many co-ops have been slow to embrace this form of clean energy generation. In this year’s report, we highlight the new, $9.7 billion grant program called New ERA (Empowering Rural America), which will empower rural electric co-ops in the Southeast to achieve clean energy adoption rates comparable to investor-owned utilities.
Even before that New ERA process officially opens, and perhaps in anticipation of it, co-ops in South Carolina have begun expanding their solar portfolios. This year’s report welcomes Santee Cooper as a new SunRiser. Santee Cooper is showcasing growth in solar in both the utility’s own plan and also the solar that Central Electric Cooperative, which is served by Santee Cooper, has commissioned directly.
That being said, this year’s report also characterizes a new SunBlocker, as well – and it’s also a co-op. The customer base for PowerSouth Energy Cooperative now exceeds 500k, qualifying it for our Large Utility System Ranking; and with its forecast solar ratio of only 169 W/C for 2026, mathematically it now must bear the SunBlocker badge of dishonor. The SunBlocker designation applies to any of the large utility systems (ultimately serving more than 500k retail customers) if the forecast for four years ahead (2026) is still less than the region-wide average from last year (2022).
Moving forward, we will unpack several of these and other observations from the report in subsequent blog posts. Stay tuned for more.
Download the Report Watch the Report Webinar Read the Report Blog Series
#SSR2023