


Communities across the Southeast, particularly frontline communities, are already living the reality of the climate crisis. Over the past year we have felt heat waves, hurricanes, and blackouts caused by extreme winter weather across our region. To avoid worsening impacts of the climate crisis, scientific guidance says we must limit warming to 1.5° C. The key to this is reducing greenhouse gas emissions. That means from here on out, every ton of greenhouse gas emitted, every resource decision to continue to rely on fossil fuels or switch to clean resources, and every policy to drive electrification, matters immensely.
We now have two major pieces of federal legislation designed to aid in decarbonization: the Bipartisan Infrastructure Law (BIL) and the Inflation Reduction Act (IRA). Together, these laws will accelerate renewables, energy efficiency, and electrification… but will it be enough?
To answer this question, SACE has compiled historical data from the past decade, and utility resource plans, called Integrated Resource Plans (IRPs), which project electricity demand and production methods into the future. The latest edition of “Tracking Decarbonization in the Southeast“ finds that current utility resource plans are not in line with overarching carbon emission reduction targets; and that our region’s utilities still have a lot of work to do before any of them are on track to decarbonize.
How Do We Track Decarbonization and Why Are We Doing It?
Decarbonization refers to the reduction of carbon dioxide emissions through transitioning to power sources that emit lower CO2 emissions. Many different sectors and users emit CO2; and many of them can use a decarbonization strategy called electrification, which means switching from direct fossil fuel use to electricity to reduce CO2 emissions. For example, electrification plays a key role in decarbonizing the transportation sector because electric vehicles are so efficient that there is the potential for significant emission reductions even taking into account the emissions associated with producing the electricity to charge them.
Utilities decarbonize by replacing fossil fuels with energy efficiency and energy from renewable sources. And especially as other sectors like transportation continue to electrify, decarbonizing the power supply is critical. Overall emissions will become lower the more we decarbonize the electricity sector. This is why our report focuses on decarbonization of the electric power sector in the Southeastern United States. (Note that generation and carbon dioxide CO2 emissions figures in the report are tied to the utility or state where the power is consumed, and not where it is generated or emitted.)
One way of tracking decarbonization of the electricity sector is by looking at the mix of resources that our region’s utilities are using to meet electricity needs. The projected resource mix across the region, based on current utility plans as of summer 2023, shows a decrease in coal, an increase in solar, and a continued reliance on fossil gas. Fossil gas generation is projected to increase by 2030 as utilities such as Duke Energy, the Tennessee Valley Authority, and Dominion Energy South Carolina all plan to add new gas-fired generation to their fleets.
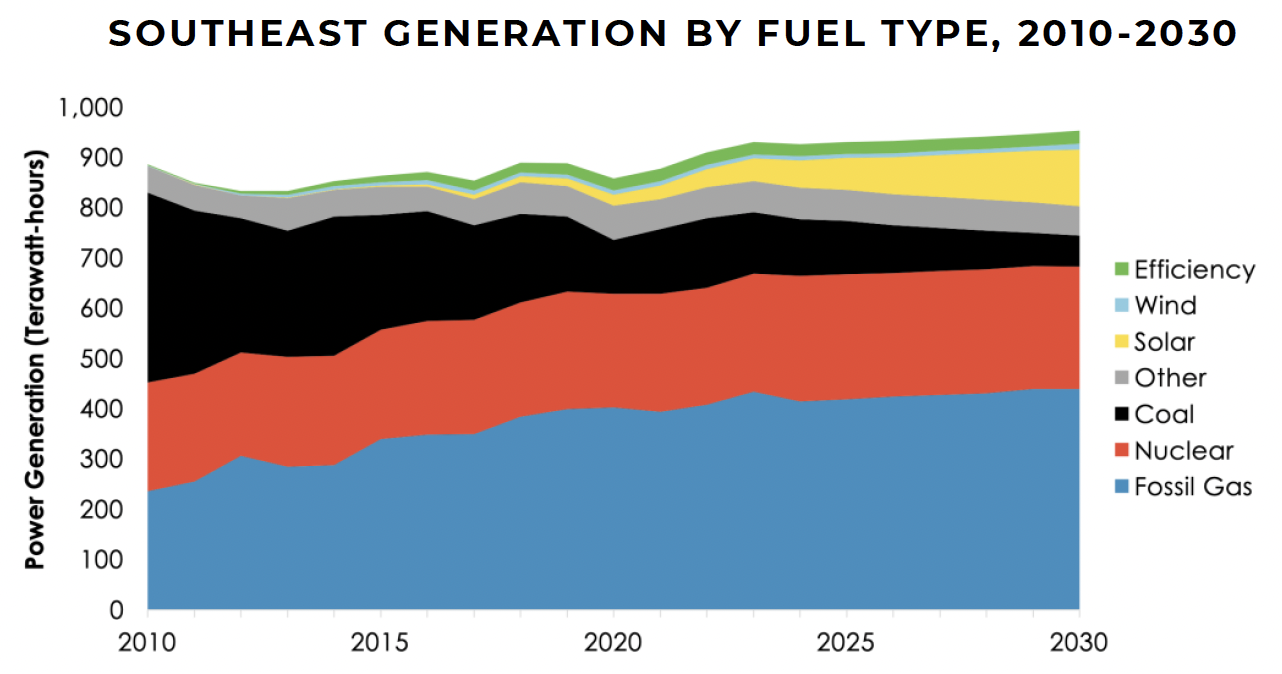
These investments in new gas plants will hinder the emissions impact of declining coal generation, and that isn’t even accounting for indirect greenhouse gas emissions. The process of producing and distributing fossil gas includes the potent greenhouse gas methane. Estimates of leakage rates are highly variable, ranging from approximately 1-5%. The inclusion of methane leaks into these figures would even further blunt the emission reduction projections presented in our report.
So how does this translate into total tons of CO2? After a steep decrease in emissions in 2020 – largely due to lower electricity demand driven by the COVID-19 pandemic – emissions rebounded in 2021 but remained below the 2019 level. Annual emissions are projected to remain above 2020’s level until 2024 as utilities continue to burn coal and gas to meet increased load. Emission reductions from 2022 through 2030 are largely driven by the reduction in coal and increase in solar generation across the region, with energy efficiency also reducing emissions.
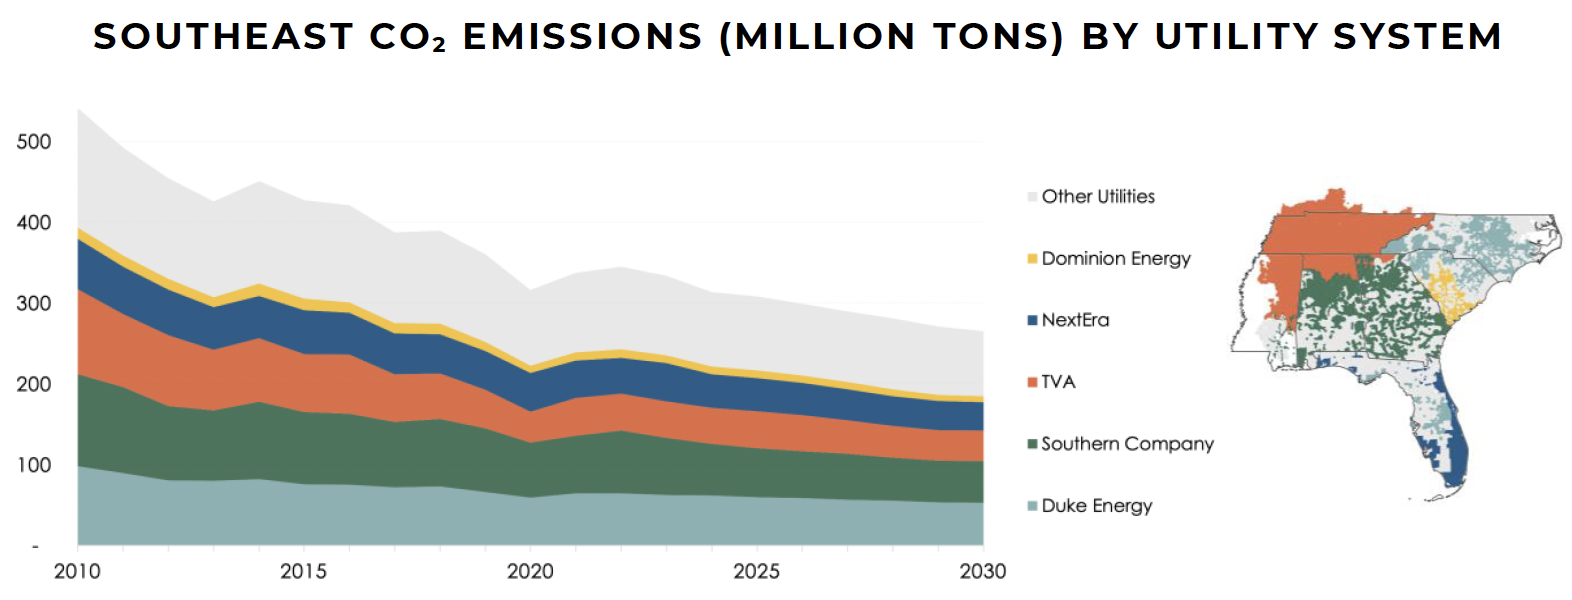
To bring forecasts in line with the Biden Administration’s target of reaching zero emissions by 2035, emissions need to be closer to 120 million tons by 2030. Regional emissions from the power sector are still projected to be over double that target. Since many utilities do not update resource plans annually it may be several years before we see the long-term emission reduction impacts of the BIL and IRA in these projections. However, we have already seen an increase in the long-term forecast for solar generation in the Southeast, likely driven by federal policy.
What’s At Stake? What Next?
As we’ve said in the past, every year matters, and every choice matters when it comes to acting on climate change. Although it is difficult to fully represent the relationship between delayed climate action and all impacts, it is possible to look at the increased cost of failing to act. Namely, weather disasters are expected to become more frequent and intense due to climate change. In the last five years, the U.S. has averaged at least $148.4 billion dollars worth of weather and climate damage each year. But likely more, as NOAA mainly catalogs climate and weather disasters that cost one billion or more dollars. Smaller disasters and costs associated with resulting healthcare needs from these events, are not included. If that $148.4 billion is spread out evenly across the year, that means the cost of inaction would increase by $4,706 every second. To see what that looks like, a cost of inaction tracker shows why climate action can’t wait.
Delaying further decarbonization until the next year, or the next IRP cycle, or the next decade, is too risky, especially when the Southeast is home to so many frontline communities that are already being negatively affected by fossil fuel reliance and the climate crisis. Stronger and more frequent extreme weather events, coastal flooding, poor air quality, and unpredictable energy prices are likely to continue to harm our communities until we move away from fossil fuels.
With so much at stake, what is the region to do? SACE primarily intervenes in state-level utility regulation and utility resource planning is one of the best opportunities to put decarbonization goals into practice, but we can also all engage on multiple levels, including supporting federal policies and regulations like the EPA’s regulation of greenhouse gas emissions from coal and gas power plants, and at the local level. Find out more about how to get involved in SACE’s efforts by joining the Clean Energy Generation.


